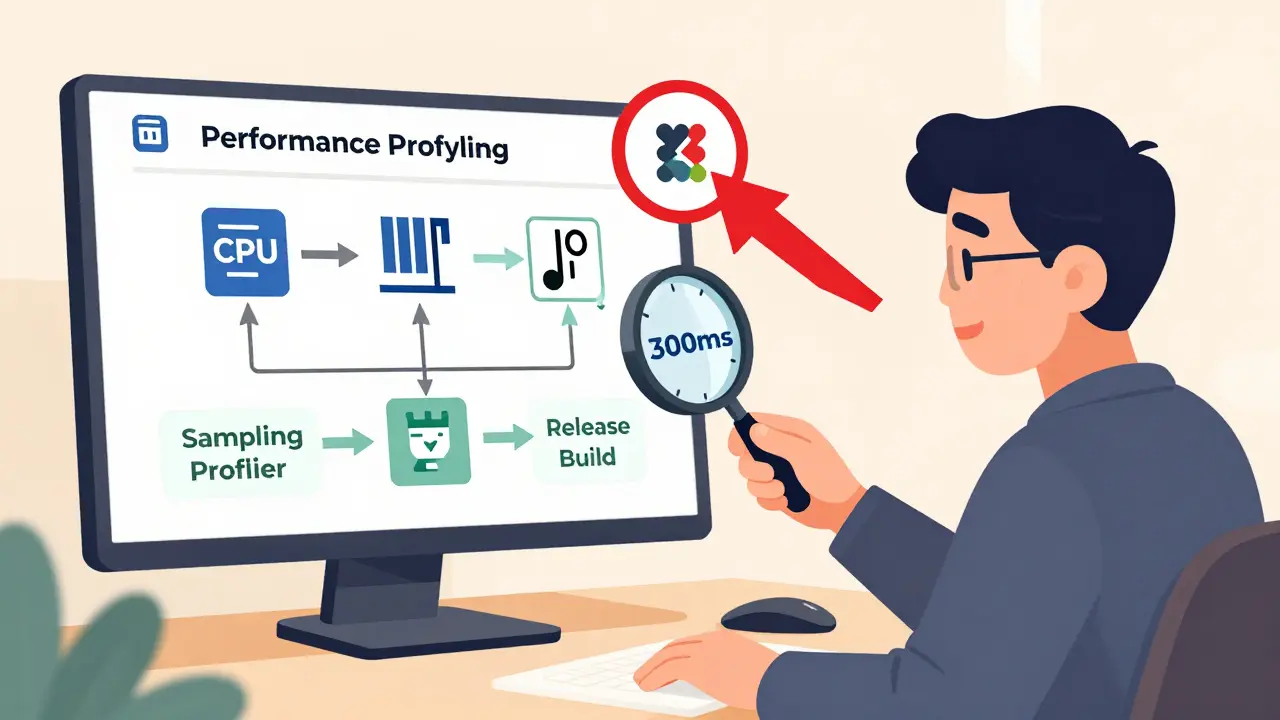
Most developers waste hours optimizing the wrong parts of their code. You run a profiler, see a function taking 12% of CPU time, and start rewriting it-only to find out later that the real problem was a texture load blocking the main thread for 300ms. This happens because performance profiling isn’t about guessing. It’s about asking the right questions, using the right tools, and following a repeatable plan.
Start with a clear goal, not a tool
Before you open Intel VTune or Unity Profiler, ask yourself: What exactly am I trying to fix? Are you chasing frame drops on a mobile device? Slow server response times? High memory usage during level loads? Without a clear target, you’ll just chase noise.Good prompts for profiling start with context. Instead of saying, “Profile my game,” say: “My Unity game drops below 30 FPS on Snapdragon 665 devices during scene transitions. Show me where time is spent in the main thread during these transitions.” This tells the profiler what hardware, what scenario, and what metric matters.
Harvard’s FASRC team found that 47% of inefficient HPC jobs failed because the team didn’t define their performance goal upfront. They assumed “faster” meant “less CPU time,” but the real bottleneck was memory bandwidth. Your goal should be measurable: “Reduce frame time from 33ms to under 25ms on target hardware.”
Use the right profiling method for the job
Not all profilers are created equal. There are two main types: sampling and instrumentation. Each has trade-offs.Sampling profilers (like perf, VisualVM, or Unity’s default mode) take snapshots of your program’s call stack every few milliseconds. They add less than 1% overhead, so they’re safe to run on release builds. But they’re approximate. If a function runs in 50 microseconds and you sample every 4ms, you might never catch it-even if it’s blocking your UI.
Instrumentation profilers (like Intel VTune or Unity’s detailed mode) insert timing code directly into your functions. They give you exact numbers down to nanoseconds. But they slow things down by 5-15%, and can distort behavior in hot loops. SmartBear’s tests showed that instrumenting a function called over a million times per second could change how the CPU’s branch predictor worked, making your optimization useless.
Here’s the rule: Start with sampling. Get a big-picture view. Then switch to instrumentation only on the top 3 offenders. Don’t instrument everything. That’s like using a microscope to find a car in a parking lot.
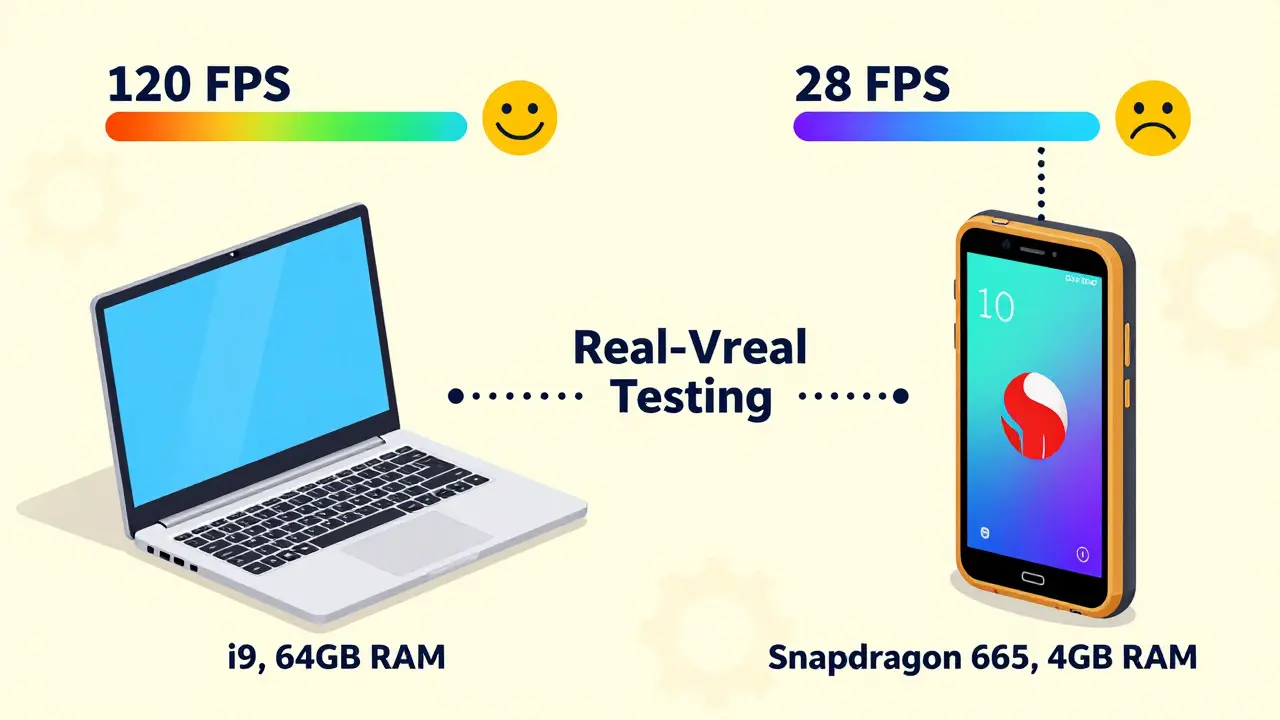
Profile on real hardware, not your dev machine
Your laptop has an Intel i9 and 64GB of RAM. Your target device? A $200 Android phone with a Snapdragon 665 and 4GB of RAM. Running your profiler on your dev machine tells you nothing about real-world performance.Unity’s data shows that 68% of mobile game performance issues come from texture sizes and draw calls-not complex algorithms. But you’ll never see that if you’re testing on a machine that can render 10,000 sprites at 120 FPS.
Set up hardware tiers: minimum, mid, and high-end. Test on each. Use reference devices. Indie developer Sarah Chen optimized her Unity game by testing on three actual phones: a Snapdragon 665, 730, and 865. She didn’t guess. She measured. Result? Average FPS on the lowest device jumped from 28.4 to 56.7.
Eliminate debug noise before you begin
If you’re profiling a Unity or Unreal project in Debug or Development mode, you’re wasting your time. These builds have extra checks:check(), ensure(), logging, debug assertions-all of which slow things down.
Epic Games found that Development builds add 18-25% overhead just from debug code. That means if your game runs at 40 FPS in Development mode, it might actually run at 50+ FPS in Release mode. But you won’t know that unless you profile the right build.
Always profile in Release or Master mode. If you need debug symbols, enable them without debug assertions. In Unreal, use a custom build configuration with USE_STATS=1 but NO_DEBUGGING=1. In Unity, switch to “Release” in the build settings. Harvard’s research showed that removing debug flags gave an immediate 22-37% speed boost across 87% of scientific workloads.
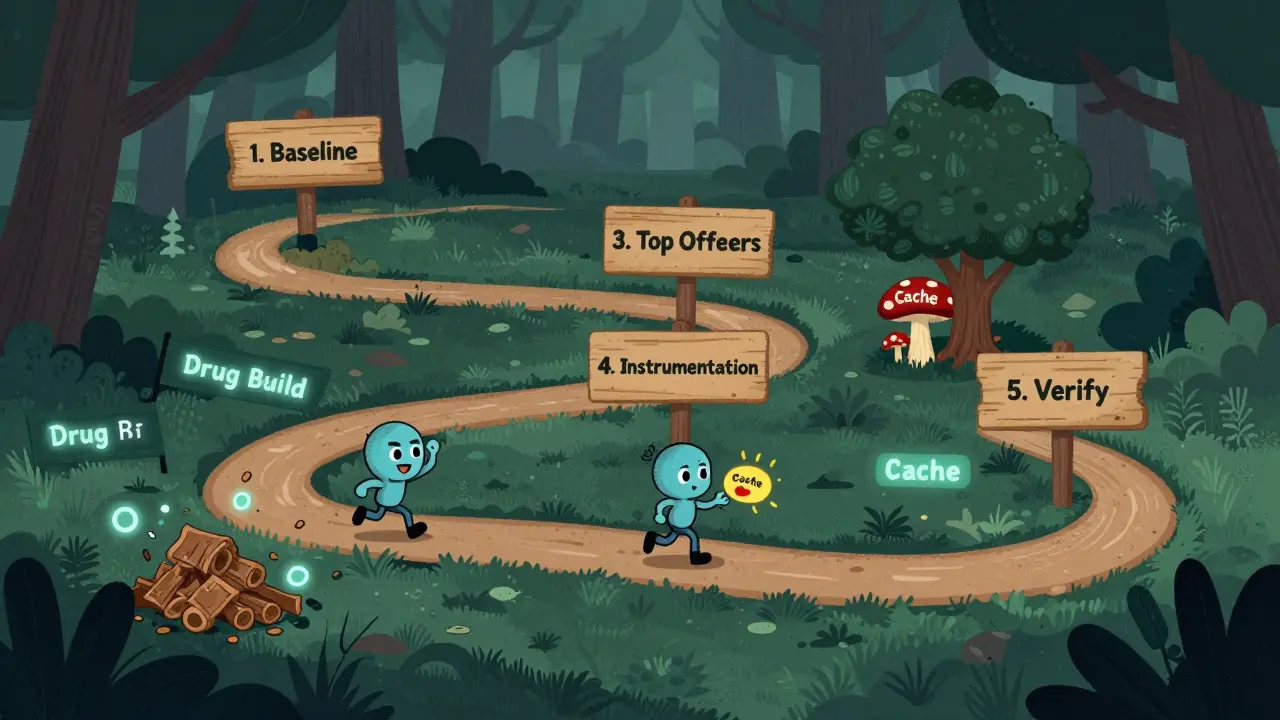
Follow the 5-step profiling workflow
Here’s the exact process used by top studios like Unity and Trimble Maps:- Establish baseline metrics-Run your target scenario (e.g., “level load”) 5 times. Record average time, memory, and frame time. Use identical inputs every time.
- Run a high-level profiling pass-Use sampling to see which categories are eating time: rendering, scripts, physics, garbage collection, I/O.
- Identify top offenders-Look for functions or systems that consume more than 5% of total time. Ignore anything under 2%. You’re not optimizing noise.
- Drill down with instrumentation-Take the top 3 offenders and run an instrumented profile. Get exact call times. Check for memory allocations inside loops.
- Optimize and verify-Change one thing at a time. Re-run the baseline. Did it improve? If not, revert. If yes, document it.
Trimble Maps used this method to fix a 17-second processing delay for “Genre: Comedy” vs. 1.7 seconds for “Genre: Children.” The issue? A single text parser was being called 12,000 times per scene. They cached the result. Time dropped to 1.8 seconds.
Watch out for profiling traps
Even experts get fooled. Here are the three most common mistakes:- Optimizing the wrong thing-Stack Overflow user ‘CodeOptimist’ spent three days optimizing a function that showed up in 15% of samples. Turns out it only used 2.1% of total time. Sampling can lie if the function is short and frequent.
- Ignoring hardware differences-A GPU bottleneck on an iPhone 14 won’t show up as a CPU issue on your Mac. Always test on target devices.
- Forgetting the human factor-If your game runs at 60 FPS but feels choppy, it’s not the frame rate. It’s frame time variance. Look at frame time distribution, not averages. A single 150ms frame will ruin the feel.
Intel’s 2024 VTune update includes “Distortion Analysis” that flags routines where instrumentation itself changed behavior. Use it. It tells you when your measurements are misleading.
Build a performance culture
Performance isn’t a phase you do before launch. It’s part of every sprint. Epic Games found that teams who started profiling in pre-production (first 3 months) had 40% better performance at launch than those who waited until alpha.Integrate profiling into your CI/CD. Run a lightweight sampler on every build. Flag if frame time increases by more than 5%. Make performance a gate-not an afterthought.
Use tools like Unity’s Adaptive Profiling (introduced in 2023) that automatically reduce overhead by only deep-profiling slow routines. Or NVIDIA’s CUDA Graph Analyzer, which uses AI to suggest optimizations. These aren’t magic. They’re just better at filtering noise.
What to do when you’re stuck
If you’ve done all this and still can’t find the bottleneck:- Check memory allocation patterns. Garbage collection spikes are often invisible in CPU profilers.
- Look at I/O. Are you loading assets on the main thread? Use async loading.
- Test with a stripped-down version of your scene. Remove everything except the core system. If performance improves, add things back one by one.
- Ask for help. Post your profiling data-screenshots, call graphs, numbers-on forums like r/gamedev or Unity’s forums. Show your baseline, your target, and what you’ve tried. People will help if you show you’ve done the work.
Performance optimization isn’t about writing faster code. It’s about finding the one thing slowing everything down-and removing it. The rest is noise.
What’s the best free profiling tool for beginners?
For Unity, use the built-in Profiler in Release mode. For C++ or Python on Windows, use Visual Studio’s Diagnostic Tools (Debug > Windows > Show Diagnostic Tools). On Linux, use perf for sampling. These tools require no setup, give you real data, and have learning curves under 20 minutes. Start here before moving to complex tools like VTune or Nsight.
How do I know if I’m optimizing too early?
You’re optimizing too early if you’re rewriting code without profiling data. If you haven’t run a baseline test, identified a top offender consuming more than 5% of time, or verified your fix improved the metric-you’re guessing. Follow the 5-step workflow. If you skip steps, you’re wasting time.
Can AI really help with performance optimization?
Yes, but not as a replacement. NVIDIA’s CUDA Graph Analyzer and Unity’s Adaptive Profiling use machine learning to spot patterns humans miss-like when a loop should be vectorized or when memory allocations cluster in a way that triggers GC. These tools suggest optimizations with 37% higher accuracy than manual analysis. But you still need to validate the change. AI finds candidates. You decide if they work.
Why does my profiler show a function taking 30% of time, but the game feels fine?
Because that function might be running on a background thread. Profilers show CPU usage, not perceived performance. If a 30% function runs on a worker thread while the main thread is idle, users won’t notice. Always check thread activity. Use a timeline view, not just a flat list. Look for main thread stalls, not total CPU load.
How often should I profile during development?
Run a quick sampling profile after every major feature change or level build. Spend 5 minutes. If frame time jumps more than 10%, investigate. Don’t wait until launch. Teams that profile weekly have 60% fewer last-minute performance fires than those who only profile at the end.
Destiny Brumbaugh
January 2, 2026 AT 02:55bro i just turned on unity profiler and it told me my texture loader was the problem lol i spent 3 days rewriting my ai pathfinding only to realize i was loading 4k textures on mobile 😭
Sara Escanciano
January 3, 2026 AT 16:52People still use Unity? The whole industry is moving to Godot and you're wasting time with profiling tools that don't even work on ARM chips. If you're not compiling to WebAssembly and running in a browser, you're already behind. This whole post is corporate propaganda disguised as advice.
Elmer Burgos
January 5, 2026 AT 04:01Really appreciate this breakdown, especially the part about profiling on real hardware. I used to test everything on my beefy rig and kept wondering why my game felt sluggish on my brother's $150 phone. Once I grabbed his actual device and ran the profiler, boom - 60% of the frame time was just texture streaming. Simple fix, huge gain. Thanks for the clear steps, this is the kind of stuff that actually saves hours.
Jason Townsend
January 6, 2026 AT 04:34they dont want you to know this but profiling tools are rigged by intel and unity to make you think you need their expensive software. the real bottleneck is always the OS background processes or the phone manufacturer's bloatware. i ran perf on my samsung and it showed 40% cpu usage on 'system_server' - that's not your code thats samsung spying on you. they want you to optimize your game so you dont notice they're stealing your data
Antwan Holder
January 7, 2026 AT 03:34performance optimization is not about code. it's about the soul of the machine. every cycle you waste on a profiler is a piece of your consciousness being siphoned into the void of corporate efficiency. that 300ms texture load? it's not a bug - it's the universe whispering to you: 'slow down'. we've forgotten how to feel the rhythm of the processor. we chase numbers like monks chasing enlightenment through spreadsheets. the real bottleneck isn't memory or cpu - it's the human belief that speed equals worth. when was the last time you just sat with your game... and listened? not to the profiler... to the silence between the frames?