
You just got the bill. It’s three times higher than last month, but your user count only grew by 10%. Where did that money go? If you’re running Large Language Models (LLMs) in production without a dedicated cost observability strategy, you’re likely bleeding cash on invisible inefficiencies. Maybe a prompt template drifted, causing token inflation. Or perhaps an agent loop got stuck, burning $12,000 in a single day. These aren't hypothetical horror stories; they are documented failures from companies scaling AI too fast.
LLM Spend Measurement is the systematic process of tracking financial resources consumed by API calls, token usage, and infrastructure to prevent uncontrolled expenditure. Unlike traditional cloud costs, AI spend is volatile and tied directly to model behavior, making standard billing reports useless for optimization. You need granular visibility into where every cent goes. This guide breaks down the exact dashboards, KPIs, and tools you need to stop guessing and start controlling your AI budget.
Why Standard Billing Reports Fail
Most teams start with the provider’s native dashboard-OpenAI’s usage page or Anthropic’s console. They show total tokens and total cost. That’s it. This data is lagging, aggregated, and lacks context. It tells you that you spent money, not why. For example, if your monthly spend jumps from $5,000 to $15,000, the provider dashboard won’t tell you if it was caused by a new feature launch, a buggy retry loop, or a shift from GPT-3.5 to GPT-4.
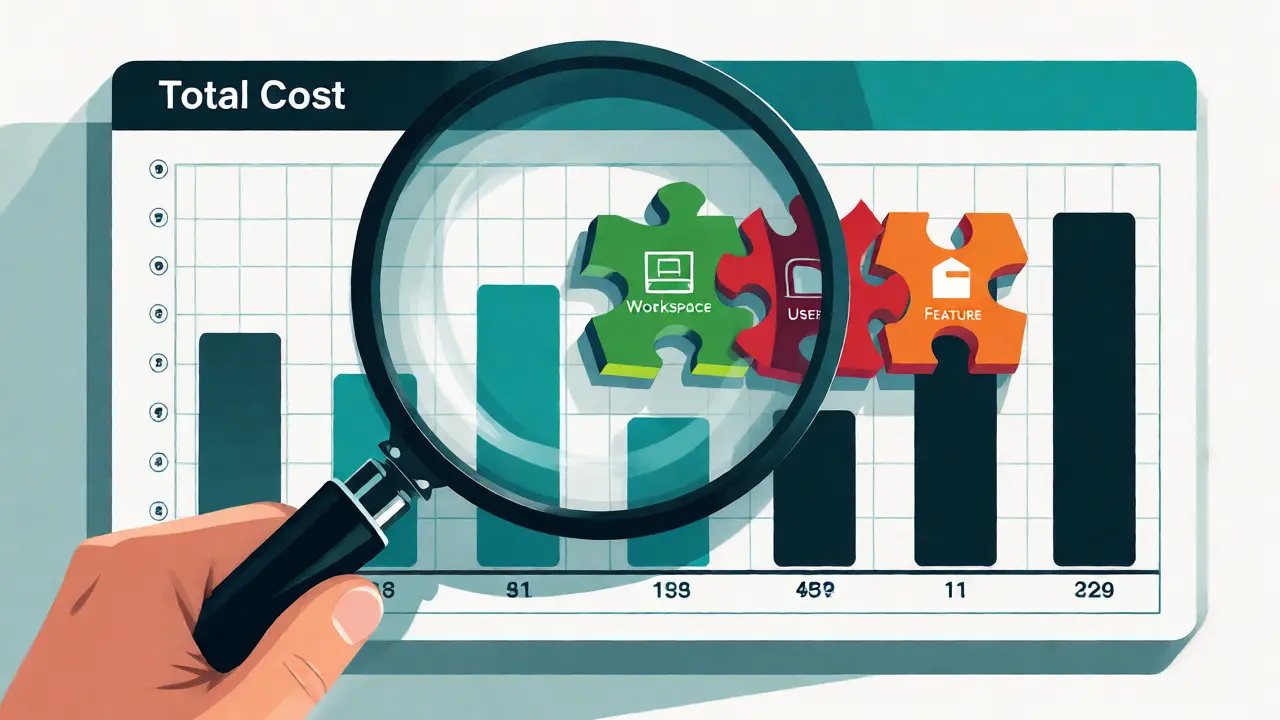
Without granular attribution, you can’t optimize. A study by Meltwater found that 61% of enterprises using only provider-level data overspent by 35% because they couldn’t identify which workflows were inefficient. You need to break down spend by workspace, user, and product feature. This requires moving beyond raw billing to active Cost Attribution, which links specific AI interactions to business units and outcomes.
The Five Core KPIs That Matter
Don’t track everything. Track what drives decisions. Here are the five metrics that actually move the needle:
- Average Cost Per Request: The baseline efficiency metric. For GPT-4-Turbo, aim for around $0.0023 per request. If this spikes, check for prompt bloat.
- Cost Per Successful Completion: Raw token cost is misleading. If a request fails and retries, you pay twice. This metric divides total cost by successful outputs, revealing true unit economics.
- Budget Consumption Rate: Calculate daily spend divided by monthly allocation. Healthy deployments maintain less than 3% daily variance. Set alerts at 85% utilization to catch overruns early.
- Token Inflation Rate: Monitor for >25% growth in token usage without functionality changes. This usually signals prompt drift or poor context window management.
- Retry Rate: High retries kill margins. Alert if the rate exceeds 5%. This often indicates timeout issues or unstable API responses.
Building Your Dashboard: What to Visualize
Your dashboard needs to answer four questions instantly: Where is spend coming from? How efficient are completions? What trends are emerging? Which changes caused the spike? Avoid clutter. Focus on actionable views.
| Metric | Target/Benchmark | Action When Exceeded |
|---|---|---|
| Cost Per Request | < $0.005 (Customer Service) | Optimize prompts or switch models |
| Daily Variance | < 3% | Investigate anomaly detection alerts |
| Retry Rate | < 5% | Check API stability or timeout settings |
| Token Growth | < 25% MoM | Audit prompt templates and context windows |
Visualize spend by model, workspace, and time. Use heatmaps to spot hourly anomalies. A sudden spike at 3 AM might indicate a batch job gone wrong. Correlate these spikes with deployment logs. If you deployed a new feature yesterday and costs jumped today, you have your culprit.
Choosing the Right Tool: Platform vs. DIY
You have three options for implementing these dashboards: enterprise platforms, open-source tools, or custom builds. Each has trade-offs.
Enterprise Platforms like Portkey or Langfuse offer pre-built dashboards and ML-powered anomaly detection. Portkey’s system identifies cost spikes from prompt drift with 94% accuracy. However, these tools can be expensive, with enterprise contracts starting at $999/month. They excel at speed-to-value but may lack flexibility for unique internal billing systems.
Open-Source Solutions such as Phoenix or LangSmith provide free tiers and greater customization. Langfuse users report a 45-hour average implementation time for basic tracking. This is ideal for startups with engineering capacity but tight budgets. The downside? You build the anomaly detection logic yourself.
Custom Builds require 8-12 weeks of engineering effort. While flexible, they often fail to capture critical context like 'cost per successful completion.' A Guru Startups audit found a 63% failure rate in Fortune 500 custom implementations due to missing outcome correlation. Unless you have highly specific regulatory or integration needs, buying is usually faster and cheaper than building.

Common Pitfalls and How to Avoid Them
Even with a dashboard, teams make mistakes. The biggest one is ignoring retry costs. Retries account for 18-22% of total spend in poorly optimized systems. If you don’t track them separately, you’ll underestimate your true cost per user.
Another trap is tracking only provider-level costs. Without workspace attribution, marketing’s chatbot might consume engineering’s budget, leading to political friction and misallocated resources. Tag every API call with a feature identifier. This allows you to calculate ROI per feature, not just per model.
Finally, don’t ignore quality. Cost looks healthy when per-request spend tracks your target, but if quality drops, you’re saving pennies and losing dollars. Correlate cost with user feedback scores. Only 32% of companies do this, yet those who do see 5.7x ROI compared to those who don’t.
Future-Proofing Your Cost Strategy
The landscape is shifting. By 2027, Gartner predicts 95% of enterprise LLM implementations will require 'cost efficiency scores' alongside accuracy metrics. Failed cost management already accounts for 44% of AI project cancellations. Don’t let your project die from a spreadsheet error.
Start small. Implement hourly tracking intervals. Set dynamic budget alerts at 85% utilization. Move from raw token counts to cost-per-successful-completion. As you scale, integrate predictive cost modeling. Some advanced platforms now quantify spend changes from specific code deployments, reducing debugging time by 63%. Stay ahead of the curve by treating cost observability as a core engineering discipline, not an afterthought.
What is the most important LLM cost metric?
The most critical metric is Cost Per Successful Completion. Unlike raw token cost, this accounts for retries and failed requests, giving you a true picture of unit economics and operational efficiency.
How often should I monitor LLM spend?
Monitor spend hourly for real-time anomaly detection and daily for budget tracking. Weekly reviews are insufficient for catching rapid token inflation or runaway agent loops that can drain budgets in days.
Can I use OpenAI's native dashboard for cost control?
Native dashboards provide aggregate totals but lack granular attribution by user, feature, or workflow. For effective cost control and optimization, you need third-party observability tools that tag and segment spend data.
What causes sudden spikes in LLM costs?
Common causes include agent loops, prompt template drift increasing token usage, high retry rates due to API timeouts, or unintentional switching to more expensive models during routing updates.
Is it worth building a custom LLM cost tracker?
Generally, no. Custom builds take 8-12 weeks and often miss critical correlations between cost and quality. Commercial or open-source observability platforms offer faster time-to-value and built-in best practices for anomaly detection.