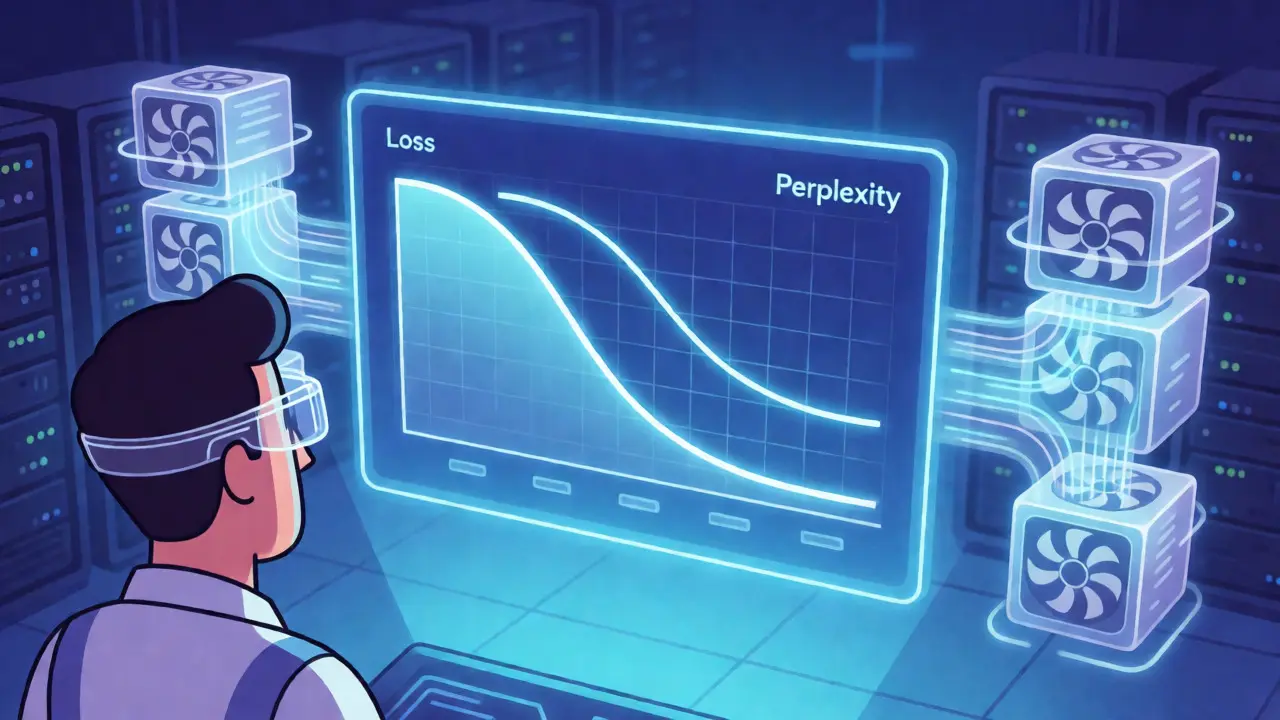
You’ve kicked off a massive Large Language Model (LLM) training run. The GPUs are humming, the fans are screaming, and your cloud bill is ticking up by the second. But how do you know if it’s actually working? You’re staring at two numbers on a dashboard: Cross-Entropy Loss and Perplexity. They drop, they plateau, sometimes they spike weirdly. If you don’t know what these signals mean, you might be wasting weeks of compute time chasing ghosts or ignoring real problems.
Think of loss and perplexity as the vital signs of your model. Loss is the raw error signal-the difference between what the model predicted and what was actually there. Perplexity is just that same information translated into a language humans can intuitively understand: "How surprised is the model?" This guide cuts through the math jargon to show you exactly how to read these metrics during training, why they matter more than any other metric in the pre-training phase, and when to trust them versus when to look deeper.
The Math Behind the Magic: From Loss to Perplexity
At its core, an LLM is trying to guess the next word in a sequence. It assigns a probability to every possible token in its vocabulary. If the model is confident and correct, the probability of the actual next token is high. If it’s confused, the probability is low. Cross-Entropy Loss measures this uncertainty using logarithms. Because probabilities are small numbers (like 0.01), we use logs to make the math stable and manageable for optimization algorithms like gradient descent.
But raw loss values are abstract. A loss of 3.5 doesn’t tell you much unless you have a baseline. That’s where Perplexity comes in. It’s simply the exponential of the average negative log-likelihood. In simpler terms, it converts the loss back into a scale that represents the "effective number of choices" the model is considering. If a model has a perplexity of 10, it behaves as if it’s picking randomly from 10 equally likely words at each step. If it’s 100, it’s way less sure.
| Cross-Entropy Loss (Nats) | Perplexity Value | Interpretation |
|---|---|---|
| 0.0 | 1.0 | Perfect prediction (impossible in practice) |
| 1.0 | ~2.7 | Extremely high confidence; near-perfect understanding |
| 2.0 | ~7.4 | Strong performance; typical for well-trained models on simple text |
| 3.0 | ~20.1 | Good performance; common range for state-of-the-art LLMs on standard benchmarks |
| 4.0 | ~54.6 | Poor performance; model struggles with context or syntax |
This table shows why practitioners prefer perplexity for reporting. Saying "our model has a perplexity of 20" gives an immediate sense of capability compared to saying "loss is 3.0." It anchors the metric to human intuition about choice and uncertainty.
Why Perplexity Rules Pre-Training
You might wonder why we don’t just use task-specific metrics like accuracy or F1-score during pre-training. The answer is data volume. During pre-training, an LLM consumes trillions of tokens from diverse sources-Wikipedia, Common Crawl, books, code. There are no "right answers" in the traditional supervised learning sense for most of this data. You aren’t asking the model to classify an image or translate a sentence specifically; you’re asking it to learn the statistical structure of language itself.
Perplexity is ideal here because it requires no reference texts. Unlike BLEU or ROUGE scores, which compare generated output to a specific human-written target, perplexity evaluates the model against the ground truth of the input sequence itself. It’s self-supervised. As noted in industry analyses, including those from AWS SageMaker documentation, lower perplexity directly correlates with a better internal representation of grammar, syntax, and basic semantic relationships.
Consider the evolution from GPT-2 to GPT-3. OpenAI didn’t just add parameters; they improved the efficiency of learning. The dramatic drop in perplexity on standard datasets like Penn Treebank signaled that GPT-3 had captured deeper linguistic patterns. While human evaluations are needed for final utility checks, perplexity provided the continuous, automated feedback loop necessary to steer training over thousands of steps without manual intervention.
Reading the Signals: What Good Trends Look Like
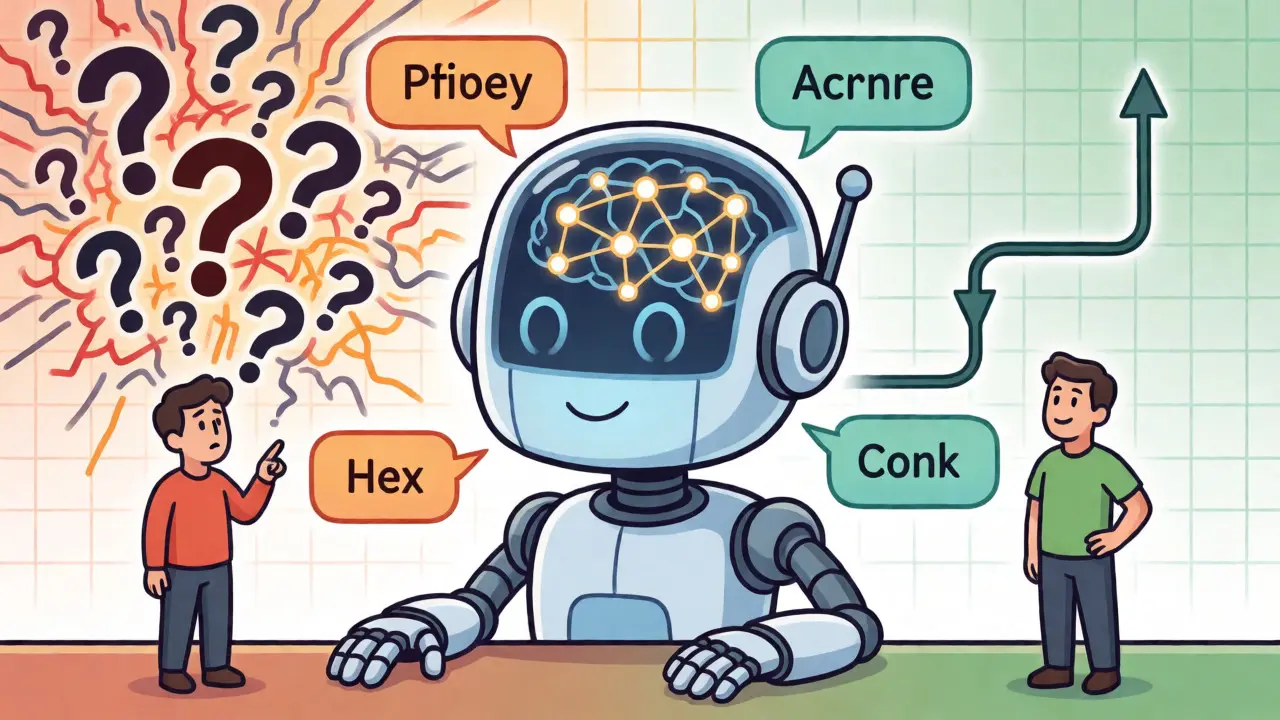
When you monitor training, you’re looking for specific shapes in your loss curves. Here’s how to interpret them:
- Smooth, Gradual Descent: This is the goal. It means the optimizer is finding consistent improvements in the weight updates. The slope should flatten out as the model approaches convergence, but never hit zero abruptly.
- Noisy Spikes: Small fluctuations are normal, especially with large batch sizes or varied data domains. However, sudden, sharp spikes often indicate a problem. Did a batch contain corrupted data? Did the learning rate get too high? Investigate immediately.
- Plateaus: If loss stops decreasing while validation loss also flattens, you’ve likely converged. But if training loss keeps dropping while validation loss stays flat or rises, you’re overfitting. The model is memorizing noise rather than learning generalizable patterns.
- Divergence: If loss suddenly explodes to infinity or NaN (Not a Number), your gradients have exploded. This usually happens if the learning rate is too aggressive or if there’s numerical instability in the attention mechanism.
A critical nuance often missed by beginners is the difference between training and validation perplexity. Training perplexity will always go down-it’s the objective function being minimized. Validation perplexity tells you if the model is actually getting smarter. If validation perplexity starts increasing while training perplexity decreases, stop training. You’ve passed the sweet spot.
Pitfalls and Misinterpretations
Despite its utility, perplexity is not a magic bullet. One major pitfall is comparing perplexity scores across different setups. A perplexity of 20 on the WikiText dataset is not comparable to a perplexity of 20 on a specialized medical corpus. Different datasets have different levels of entropy and predictability. Always compare within the same domain and tokenizer configuration.
Another trap is assuming low perplexity equals high quality. Research highlighted in recent arXiv papers demonstrates that models can achieve low perplexity by mastering surface-level statistics while failing at deep reasoning or factual consistency. For example, a model might perfectly predict the next word in a cliché phrase but fail to maintain logical coherence over long contexts. This is why modern pipelines increasingly combine perplexity monitoring with other diagnostics, such as probing tasks or human-in-the-loop evaluations.
Also, beware of tokenizer artifacts. If you change your tokenizer mid-experiment, your perplexity scores become incomparable. Different tokenizers split words differently, affecting the length of sequences and the complexity of predictions. Stick to one tokenizer for consistent benchmarking.

Practical Implementation Tips
Setting up effective monitoring doesn’t require supercomputers. Evaluation overhead is minimal-typically less than 2% of total compute time according to AWS benchmarks. Here’s a practical checklist for your training pipeline:
- Set Up Validation Loops: Don’t wait until the end of training. Compute validation loss/perplexity every N steps (e.g., every 500-1000 steps). This frequency balances insight with computational cost.
- Use Held-Out Data: Ensure your validation set is strictly separate from training data. Even 1% leakage can artificially inflate performance metrics, giving you false confidence.
- Normalize Correctly: Calculate perplexity per token, not per sequence. Longer sequences naturally have higher cumulative errors, so averaging per token ensures fair comparison across variable-length inputs.
- Visualize in Real-Time: Use tools like Weights & Biases or TensorBoard. Static logs are hard to scan for trends. Live dashboards let you catch divergence early and adjust hyperparameters on the fly.
- Track Multiple Metrics: While perplexity is king for pre-training, consider adding secondary signals like gradient norm magnitude or activation histograms. These help diagnose issues before they manifest in loss curves.
For instance, if you notice validation perplexity plateauing early, check your learning rate schedule. A common fix is implementing a warm-up phase followed by cosine decay. This smooths out initial instability and helps the model settle into a better minimum.
The Future of Evaluation Metrics
The landscape is shifting. While perplexity remains the dominant diagnostic tool-with nearly all major foundation models reporting it-reliance on it alone is decreasing. Industry forecasts suggest a move toward hybrid frameworks. New techniques like "Ask-LLM" scoring or contextual perplexity aim to capture semantic coherence and reasoning capabilities that traditional perplexity misses.
However, for the foreseeable future, understanding and monitoring cross-entropy loss and perplexity remains non-negotiable. They are the foundational signals that guide optimization. Mastering their interpretation allows you to build faster, cheaper, and more reliable models. Instead of guessing whether your training run is healthy, you’ll have clear, quantitative evidence to drive your decisions.
What is a good perplexity score for an LLM?
There is no universal "good" score because it depends heavily on the dataset. On standard benchmarks like Penn Treebank, state-of-the-art models typically achieve perplexity between 20 and 25. On more complex or noisy web text, scores might range from 50 to 100+. Always compare your model against baselines trained on the same data.
Why does my validation perplexity increase while training loss decreases?
This is a classic sign of overfitting. The model is memorizing the training data’s noise rather than learning generalizable patterns. To fix this, try adding regularization (like dropout), increasing the size of your training dataset, or stopping training earlier based on the validation curve.
Can I compare perplexity scores between different models?
Only if they use the same tokenizer and are evaluated on the exact same dataset. Different tokenizers break text into different units, changing the difficulty of prediction. Similarly, evaluating on different corpora makes comparison meaningless due to varying linguistic complexity.
Does low perplexity guarantee a good chatbot?
No. Low perplexity indicates strong fluency and grammatical correctness, but it doesn’t measure factuality, helpfulness, or reasoning ability. A model can be fluent yet hallucinate facts. Use perplexity for pre-training diagnostics, but rely on task-specific evaluations for final product quality.
How often should I calculate perplexity during training?
A common heuristic is every 500 to 1000 steps. This provides enough data points to see trends without slowing down training significantly. If your runs are very short, evaluate more frequently; for long runs, you can space it out further to save compute.