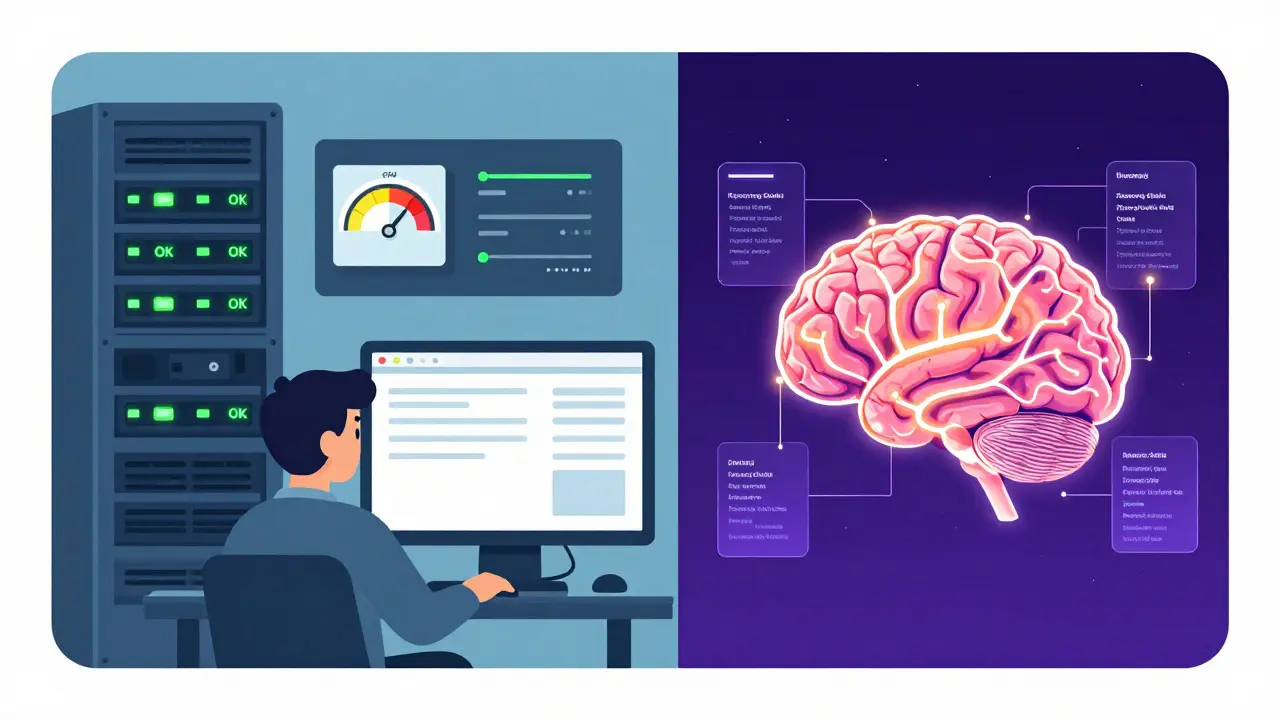
Imagine deploying an autonomous AI agent to handle customer support tickets. It works perfectly in testing. Then, it hits production. Suddenly, you notice costs spiking. Responses are getting longer but less helpful. Worse, the agent occasionally hallucinates facts or calls tools incorrectly. You check your standard server logs-CPU is fine, memory is stable, no errors. Everything looks green. Yet, the system is failing. This is the classic blind spot of traditional monitoring when applied to Large Language Model (LLM) agents, which are autonomous AI systems that use large language models to reason, plan, and execute tasks using tools.
The problem isn’t infrastructure; it’s semantics. Traditional monitoring tracks whether a server is up. Observability is the practice of inferring internal states of a system from external outputs, specifically tracking semantic signals like reasoning quality, tool usage, and output accuracy. For LLM agents, observability is not optional-it is the only way to understand why an agent made a specific decision, how much it cost, and whether it was safe.
Why Traditional Monitoring Fails LLM Agents
You cannot monitor agents like traditional software. The inputs are infinite. The behavior is non-deterministic. Two identical prompts can yield different responses based on temperature settings or subtle context shifts. Standard metrics like latency and error rates miss the core issues: hallucinations, toxicity, factual inaccuracies, and poor reasoning chains.
Consider a Retrieval-Augmented Generation (RAG) system. If the retrieval step fails to find relevant documents, the LLM might still generate a confident-sounding answer that is completely wrong. A traditional log would show a successful HTTP 200 response. An observability platform would flag low relevance scores in the retrieved context and high uncertainty in the final output.
AWS Prescriptive Guidance emphasizes that agentic systems require observability beyond traditional metrics because autonomous agents make decisions creating variable execution paths. When agents orchestrate multiple tools, a failure in one tool call can cascade into a complete task failure. Without visibility into each step of the agent’s trajectory, debugging becomes guesswork.
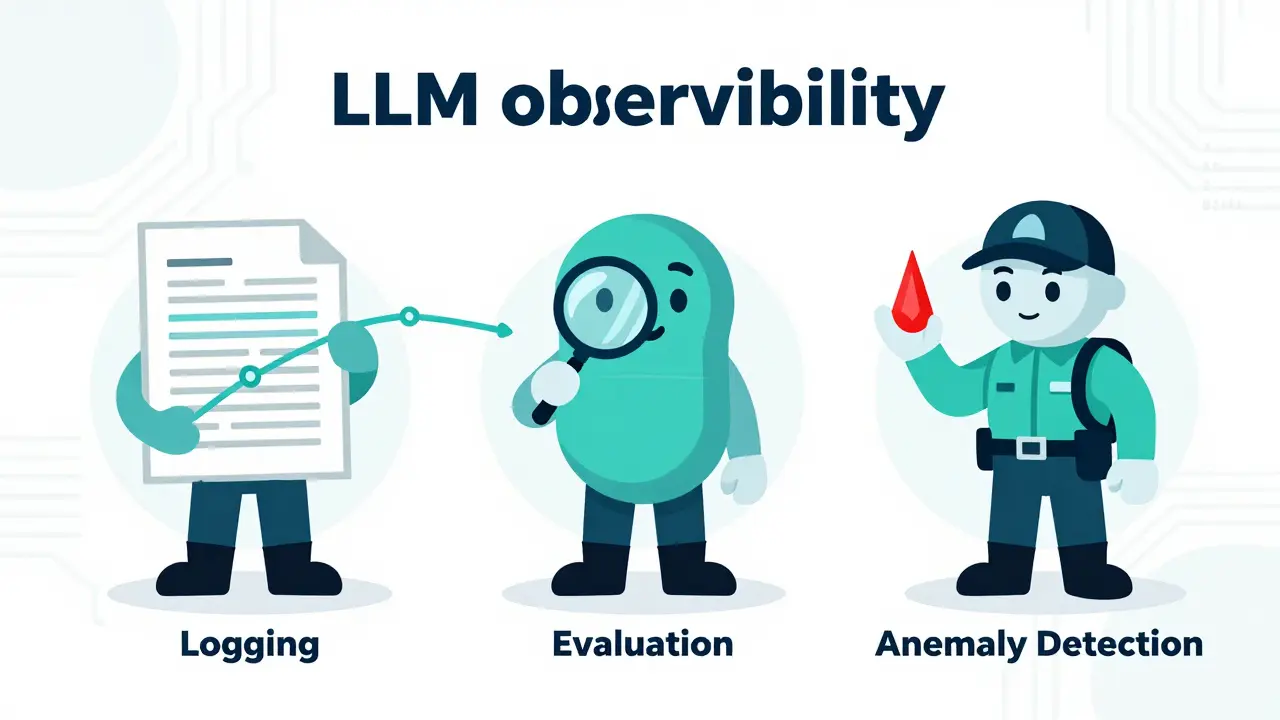
The Core Components of LLM Observability
Effective observability for LLM agents rests on three pillars: logging, evaluation, and anomaly detection. Each serves a distinct purpose in the lifecycle of an agent deployment.
- Structured Logging: Capturing every step in the LLM pipeline, including prompts, responses, tool calls, arguments, and intermediate reasoning steps. Unlike unstructured text logs, structured logs allow for querying and analysis.
- Output Evaluation: Assessing the quality of responses using automated metrics (like factuality checks) or human feedback. This helps establish baselines for what “good” looks like.
- Anomaly Detection: Automatically flagging spikes in toxicity, abnormal output lengths, or sudden changes in token usage that might indicate model drift or adversarial attacks.
These components work together to create a feedback loop. Logs provide the raw data, evaluations interpret that data against quality standards, and anomaly detection alerts you when things go off the rails.
AgentTrace: A New Standard for Structured Agent Logging
One of the most significant developments in this space is AgentTrace, a research framework establishing the first open standard for structured agent logging through a schema-based approach. AgentTrace instruments LLM agents at runtime without requiring code modifications, introducing a three-surface taxonomy: cognitive, operational, and contextual.
| Surface | Focus Area | Key Data Points |
|---|---|---|
| Cognitive | Reasoning & Deliberation | Chain-of-thought steps, decision rationale, confidence scores |
| Operational | Execution & Control Flow | Tool calls, API interactions, latency, token counts |
| Contextual | Environment & State | User session history, retrieved documents, system prompts |
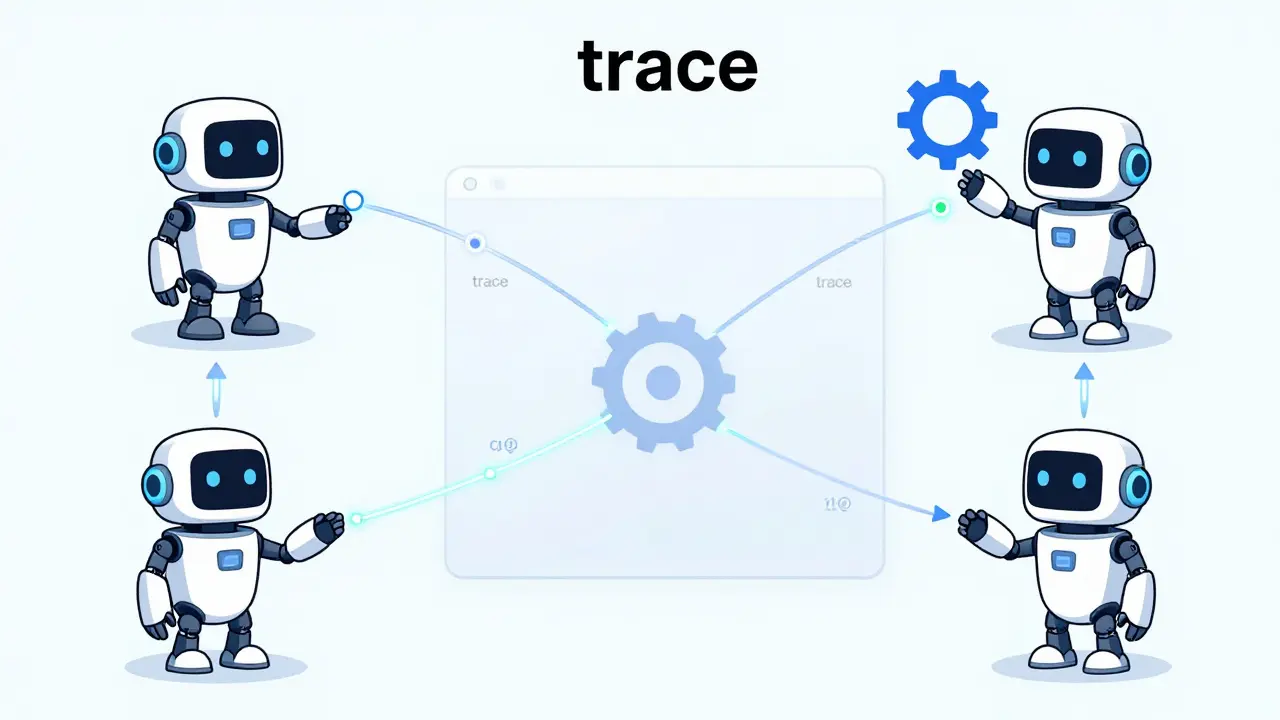
This structured approach transforms logging from a simple audit trail into a semantically rich substrate. It allows engineers to introspect not just what the agent did, but why it did it. By integrating with existing telemetry infrastructures like OpenTelemetry, which enables capture of sequences of events through traces crucial for understanding complex workflows, AgentTrace provides scalable, real-time observability.
Building Your Technical Stack
You don’t need to build everything from scratch. The modern LLM observability stack combines established tools adapted for AI contexts. Here is a practical breakdown of what you need:
- Tracing Infrastructure: Use Jaeger or a distributed tracing system that visualizes request flows across services to visualize the entire journey of a user query from input to final response. This is critical for RAG systems where events occur before and after LLM usage.
- Metric Collection: Deploy Prometheus, a monitoring and alerting toolkit designed for reliability engineering to collect time-series data on token usage, cost per request, and latency. These metrics give you a quick overview of performance and financial impact.
- Visualization: Connect Prometheus to Grafana, a platform for monitoring and observability that provides dashboards for real-time data visualization. Create custom dashboards to track success metrics like task completion rates or user satisfaction scores.
- Structured Logging: Implement JSON-based logging formatters in Python. Ensure every log entry includes metadata such as trace IDs, model versions, and prompt templates. This makes downstream analysis possible.
For teams looking for an all-in-one solution, platforms like LangSmith, built by LangChain to address the specific needs of teams deploying LLM applications, offer integrated tracing, evaluation, and dataset management. Similarly, Wandb and Datadog have expanded their offerings to include specialized LLM observability features.
Key Signals to Monitor in Production
Not all metrics are created equal. Focus on signals that directly impact user experience and business outcomes. Here are the critical areas to watch:
- Quality Metrics: Track how often the agent produces helpful, relevant, and correct responses. Use automated evaluators to score factuality and coherence. Detect quality degradation due to model updates or data drift.
- Cost Efficiency: Monitor token usage per request and total monthly spend. Identify expensive queries or inefficient loops where the agent retries tasks unnecessarily.
- Latency: Measure end-to-end response time. Break down latency by component (retrieval, LLM inference, tool execution) to pinpoint bottlenecks.
- Safety Signals: Flag instances of toxicity, bias, or PII leakage. Set up alerts for unusual patterns that might indicate prompt injection attempts.
- Topic Tagging: Automatically classify production queries into categories. This provides product analytics insights into what users are actually trying to accomplish.
Drill-down capabilities are essential. When an alert triggers, you should be able to move from aggregate metrics into specific traces to investigate the root cause. For example, if cost spikes, drill down to see which specific tool calls or reasoning steps are consuming the most tokens.
The Continuous Improvement Loop
Observability is not just about monitoring; it’s about improving. The most effective teams integrate production observability directly into their development cycle. Here is how the loop works:
- Capture: Production traces reveal failure cases, edge cases, and unexpected behaviors.
- Annotate: Teams review these traces in annotation queues, labeling them as positive or negative examples.
- Dataset Creation: These labeled examples are incorporated into test datasets.
- Experiment: Developers test fixes or new prompt strategies against these datasets to ensure improvements.
- Validate: Online evaluations validate fixes in production before full deployment.
This continuous loop transforms production data into actionable improvements. It closes the gap between development and operations, ensuring that the agent gets better over time. As noted by industry leaders, instrumenting agents from the first prototype builds evaluation baselines that carry through to production governance without requiring separate tooling.
Challenges with Multi-Agent Systems
If you are building multi-agent systems, the complexity increases exponentially. Multiple agents communicating with each other require enhanced observability. You need to track inter-agent communication patterns, cascading errors, and shared context management.
In a multi-agent architecture, one agent might delegate a task to another. If the second agent fails, the first agent must detect this and either retry or escalate. Observability must capture these handoffs clearly. Trajectory-level tracing becomes even more critical, as you need to see the entire conversation history across all agents involved in a single user request.
Additionally, multi-turn context management across sessions adds another layer of complexity. Ensuring that context windows are utilized efficiently and that relevant information is retained across long conversations requires careful monitoring of context length and relevance scores.
What is the difference between monitoring and observability for LLMs?
Monitoring focuses on operational metrics like server uptime, CPU usage, and error rates. Observability goes deeper, capturing semantic signals such as reasoning quality, hallucination rates, and tool usage effectiveness. For LLMs, observability is essential because the value lies in the content and logic of the output, not just the system's health.
Why is structured logging important for AI agents?
Structured logging captures detailed information about each step in an agent's workflow, including prompts, responses, and tool calls, in a machine-readable format like JSON. This allows for automated analysis, anomaly detection, and efficient debugging, unlike unstructured text logs which are difficult to query at scale.
How does AgentTrace improve agent observability?
AgentTrace introduces a standardized, schema-based logging framework that categorizes logs into cognitive, operational, and contextual surfaces. This allows developers to introspect not just what an agent did, but why it made certain decisions, providing deeper insight into its reasoning process without modifying application code.
What tools are best for LLM observability?
A combination of OpenTelemetry for tracing, Prometheus for metrics, and Grafana for visualization forms a strong foundation. Specialized platforms like LangSmith, Wandb, and Datadog also offer tailored features for LLM applications, including automated evaluation and dataset management.
How do I handle observability in multi-agent systems?
Multi-agent systems require trajectory-level tracing to track inter-agent communication and cascading errors. You need to monitor shared context management and ensure that logs capture the entire conversation history across all agents involved in a single task to identify bottlenecks or failures in delegation.
Ben De Keersmaecker
May 6, 2026 AT 17:27I've been wrestling with RAG systems for the past six months and this post hits the nail on the head regarding the 'semantic blind spot'. We spent weeks optimizing our vector database retrieval speed, thinking that was the bottleneck. It wasn't. The issue was that our LLM was confidently hallucinating answers when the retrieval score was just below our threshold, but we had no way to flag that specific semantic failure in our logs. Standard HTTP 200 responses are so misleading in this context. I finally started implementing a simple JSON log structure that captures the top-3 retrieved chunks alongside the final answer, and it made debugging ten times easier. It’s wild how much effort goes into infrastructure monitoring while the actual intelligence part remains a black box.
Chris Heffron
May 6, 2026 AT 18:06Great read! :) One thing I noticed is that while AgentTrace sounds promising, integrating it with existing OpenTelemetry setups might be tricky for smaller teams who don't have dedicated DevOps engineers. Has anyone here tried using LangSmith for multi-agent systems? I'm curious if it handles the inter-agent communication tracing well or if you still need custom solutions for that part. :)
Adrienne Temple
May 7, 2026 AT 03:46This is super helpful! I am new to building AI agents and I was totally lost on where to start with monitoring. I thought just checking if the server was up was enough, but now I see why that is not right. The part about cost efficiency really worried me because I did not know tokens could get so expensive so quickly. I will try setting up Prometheus to track token usage. Thanks for sharing this guide! :)
Sandy Dog
May 7, 2026 AT 17:12Oh my goodness, this entire situation sounds like a absolute nightmare from hell! I can barely imagine the sheer panic of watching your costs spike while your agent spouts nonsense to customers, knowing full well that your standard logs are just sitting there smiling back at you with those green checkmarks! It is literally terrifying! And then you have to dig through all these complex traces and reasoning chains, trying to figure out which tiny step went wrong in a sea of data! I mean, who even has the time or the energy to deal with this kind of technical chaos?! It makes me want to scream! But hey, at least we have AgentTrace now, right? Because clearly, we needed one more layer of complexity in our lives! Ugh!
Paritosh Bhagat
May 7, 2026 AT 17:30You people are completely missing the point here! This article is basically just another marketing fluff piece designed to sell you more tools you do not need. Who cares about 'semantic signals'? If your code is bad, fix your code! Do not blame the monitoring system for your inability to write deterministic logic. It is disgusting how everyone rushes to adopt these fancy new frameworks without understanding the basic principles of software engineering. You should be ashamed of yourselves for relying on such unstable technology for customer support. It is unethical! Stop wasting money on observability platforms and start writing better prompts! Grammar police note: 'non-deterministic' is often misused in these contexts by amateurs.
Nick Rios
May 8, 2026 AT 03:08I think Paritosh is being a bit harsh, but I understand his frustration. The industry is moving fast and it is easy to feel overwhelmed. For Adrienne, do not worry too much about the complexity at first. Start small. Just logging the input and output is a huge step forward compared to nothing. As you grow, you can add more layers like the ones mentioned in the post. It is important to find a balance between gathering data and actually building features. Good luck with your project!
Aaron Elliott
May 8, 2026 AT 18:31The fundamental error in this discourse lies in the assumption that observability equates to control. One cannot observe the unobservable nature of stochastic parrots with any degree of certainty. The concept of 'reasoning quality' is a subjective metric masquerading as an objective truth. Furthermore, the reliance on structured logging for cognitive processes is akin to attempting to measure the color of sound. It is a category mistake. The only true observability is the user's dissatisfaction, which is the ultimate metric. All other metrics are merely proxies for a deeper epistemological crisis in AI development.